 to select a layer that
will be used to calculate profile.
to select a layer that
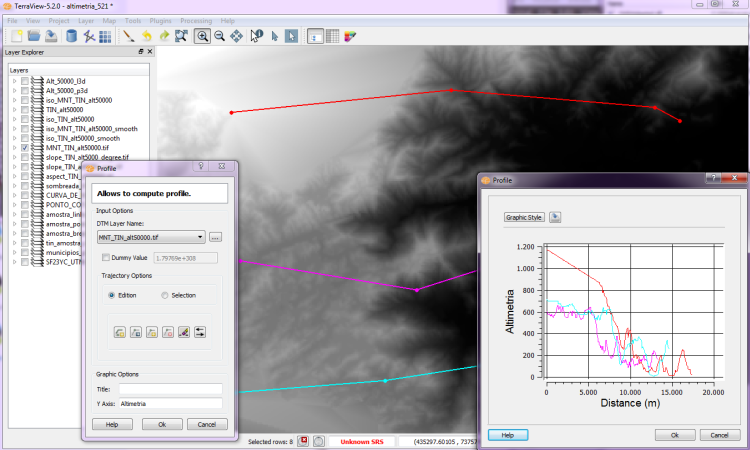
will be used to calculate profile. A certain type of DTM, such as a topographic surface, can be represented through profiles which describe point elevation (z value) in a line. This action is performed over numeric model data (grid or isoline) in raster format, presenting in a chart the z value equivalent to point that define the trajectory.
It is accessible through:
PROCESSING → DTM PROCESSING → PROFILE...1. Input Layer
to select a layer that
will be used to calculate profile. If the selected layer does not have 3d information in its geometry, in the Quota Column combobox, select the attribute that contains the attribute to be used.
2. Trajectory Options:
 Create
trajectory by click on the path.
Create
trajectory by click on the path. Move
selected point in the trajectory.
Move
selected point in the trajectory. Add
a point on selected trajectory.
Add
a point on selected trajectory. Delete
selected point from the trajectory.
Delete
selected point from the trajectory. Delete
selected trajectory.
Delete
selected trajectory. Invert
trajectory direction.
Invert
trajectory direction. to select lines, shift +
to select more than one line.
to select lines, shift +
to select more than one line.3. Graphic Options :