Pie Chart
and Bar Chart
This interface allows the
user to generate pie/bar charts from the choice of attributes of
the selected layer. These charts assist in the interpretation of data,
highlighting the selected attributes.
It is
accessible through:
Layer
Explorer > Right Click over a
Layer-name > Pie/Bar
Chart...
To create a pie/bar chart is required
the following steps:
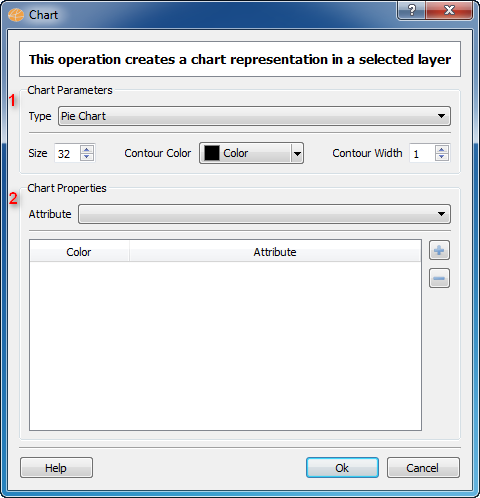
- Define the parameters of the
chart.
- Type: Specifies the type of chart being used.
- Size: This parameter defines the size of the
charts to be drawn on the map display.
- Contour Color: Sets the outline color of the chart.
- Contour Width: Sets the outline width of the chart.
- Define the properties of the
chart.
- The "Attribute" field have
a list of attributes belonging to the selected layer.
- Using the (+) and (-)
buttons the user can add or remove the desired attributes.
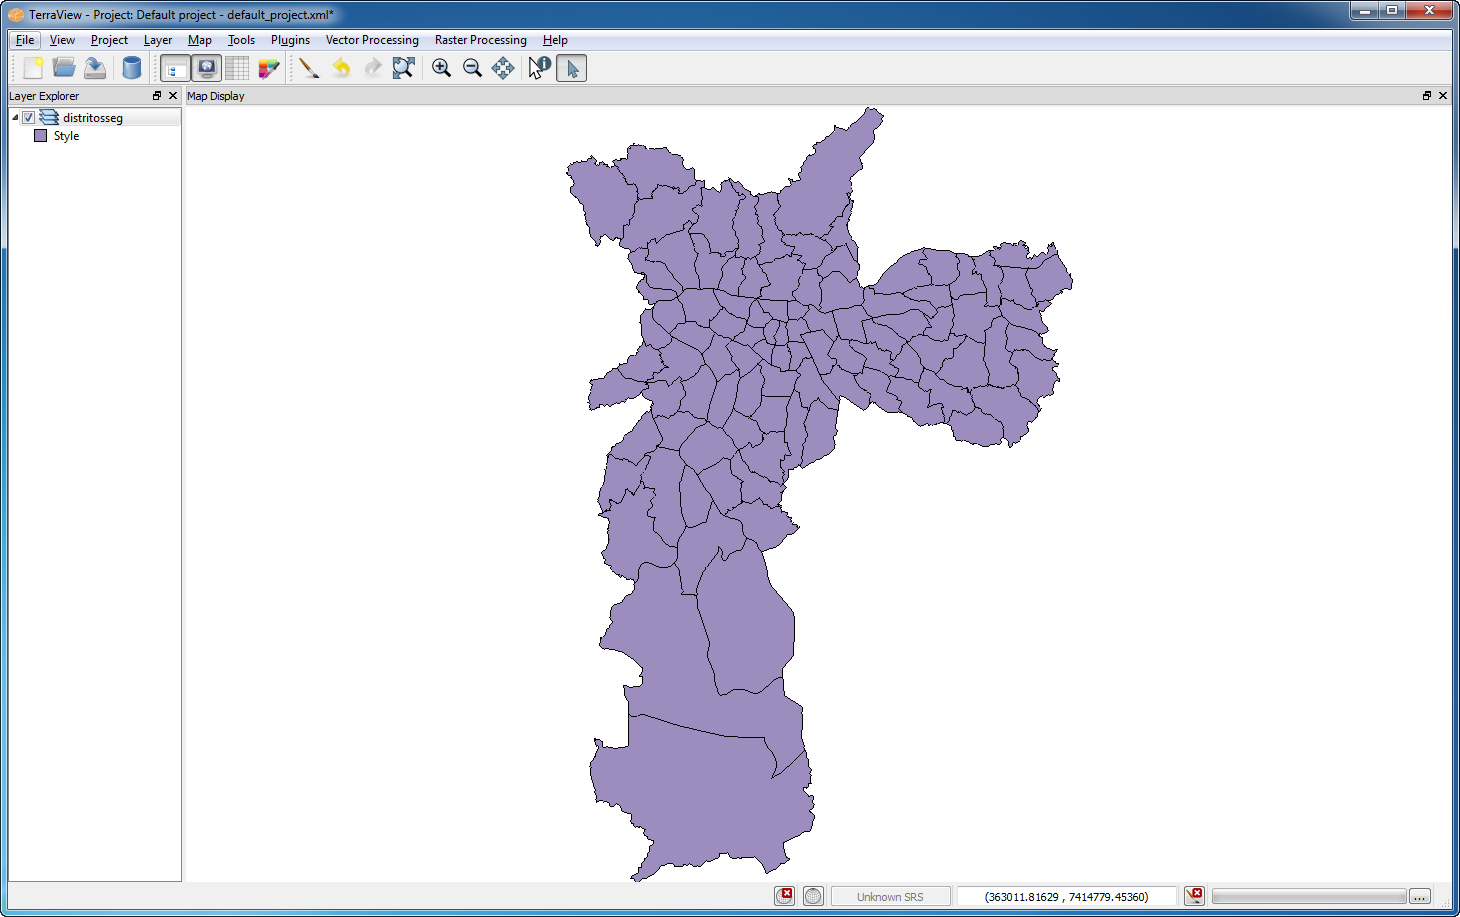
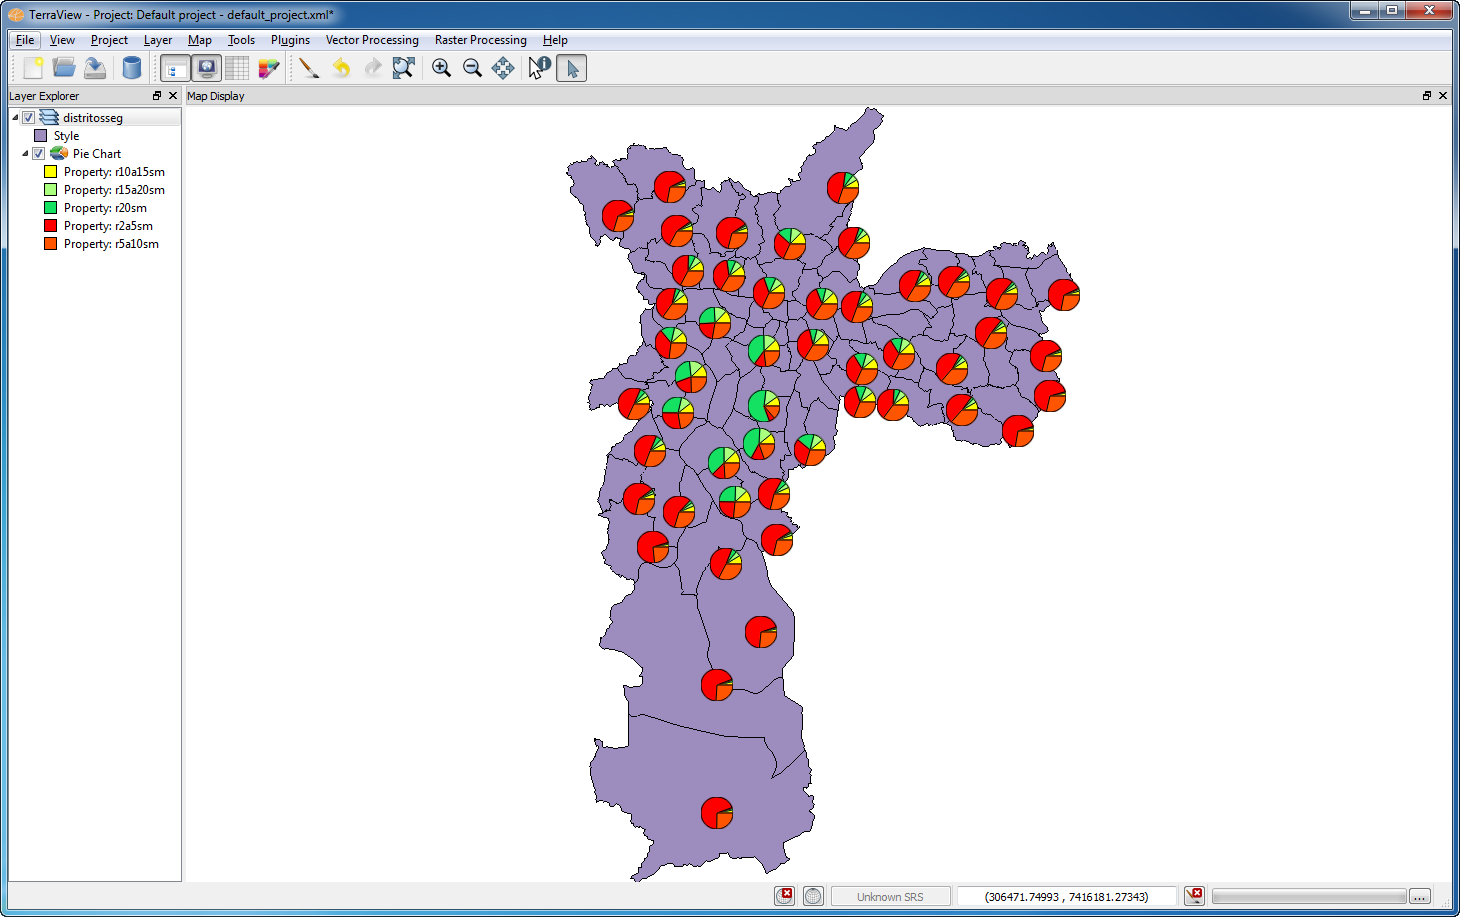
An example of data analysis that can be done with the help of charts is
the comparison between compatible attributes. Using data from the
districts of São Paulo is possible to make a comparison of the
income distribution using the attributes that indicate the salary
ranges based on the minimum salary.
The
attributes used were:
- 2 to 5 minimum salaries.
- 5 to 10 minimum salaries.
- 10 to 15 minimum salaries.
- 15 to 20 minimum salaries.
- more than 20 minimum salaries.
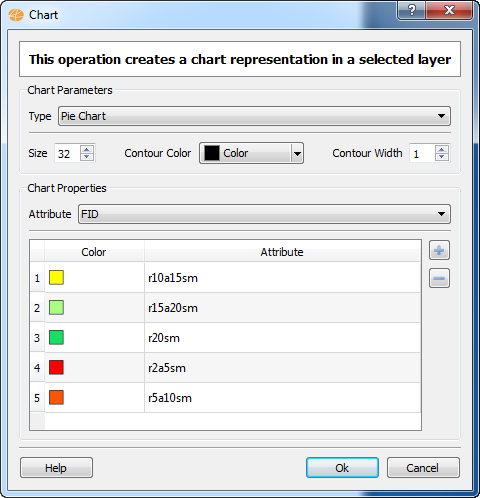
The
result represented by pie chart is as follows:
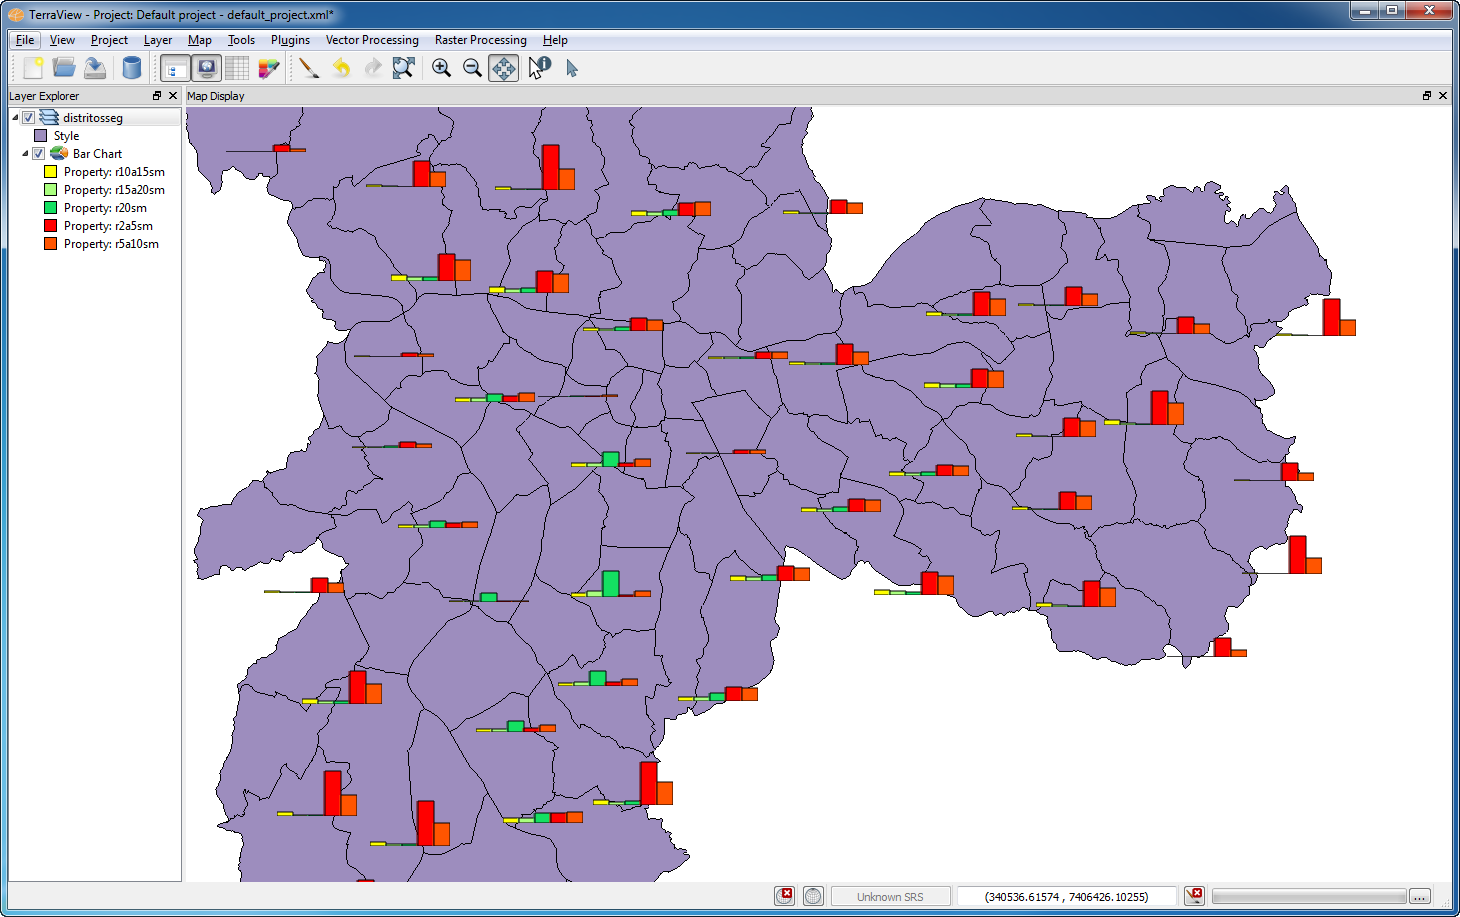
The
result represented by bar chart is as follows: