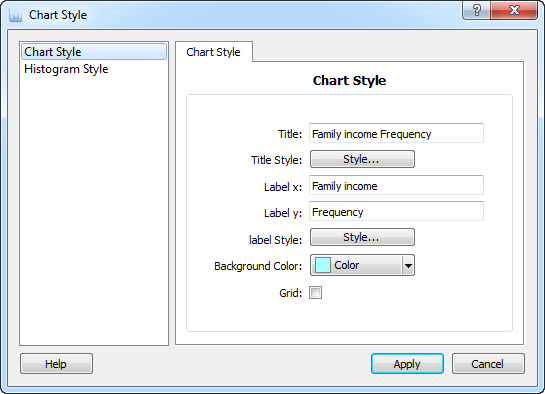
Chart Style
It is
used to define some of
the information related to how the chart
is displayed, such as the font of it's title, the text on it's labels,
the background color, among other properties, these can be edited
once the chart has been created.. That can be done using the
Chart Style window. For example:
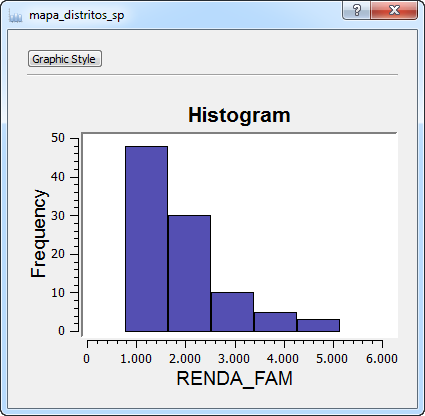
On any
chart, like the example shown above, by clicking on the
Graphic Style button the following window will be opened:
Interface
description:
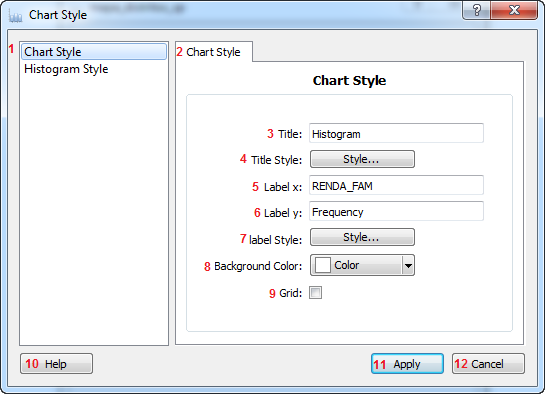
1 - Chart style item - When selected, displays the window
used to configure a chart's style.
2 - Chart Style tab - Displays the window used to
configure a chart's style.
3 - Title - Displays the chart's current title, and allows it's
edition.
4 - Title Style Button - Displays
the window used to
configure the title's font.
5 - Label x - Displays the chart's current x axis
label, and allows it's edition.
6 - Title - Displays the chart's current y axis label,
and allows it's edition.
7 - Label Style Button - Displays
the window used to
configure the label's font. It will be the same for both the x and y
axis.
8 - Color Button - Displays
the window used to
configure the background's color.
9 - Grid Button - Used to
decided weather or not to display the grid.
10- Help button - Opens the help window.
11 - Apply button - Closes the
window applying the changes that were made.
12 - Cancel button - Closes the window without applying
any changes.
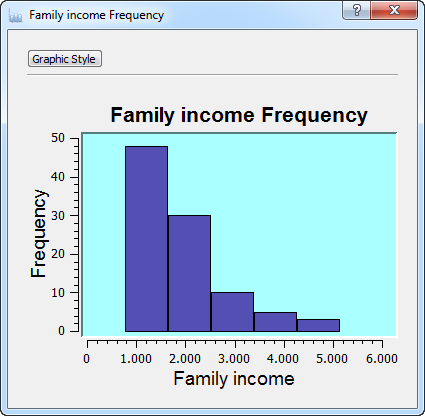
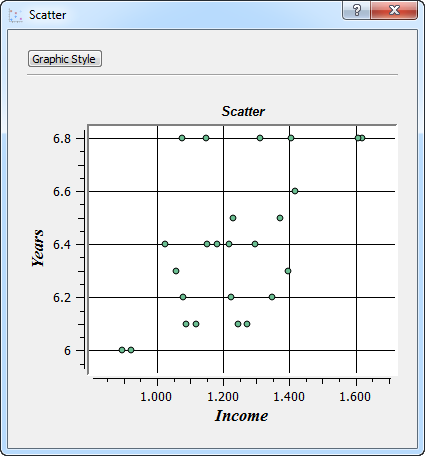
Examples of it's use and the changes being reflected on the chart: