The Classification
is a interface used for vector data and raster data
either. The basic principle of this type of classification is grouping
the data following the logic of some selected method.
It is
accessible through:
Layer
Explorer > Right Click over a
Layer-name >
Classification...
Layer > Classification...
If the user selects a layer with vector representation, the
interface for vector classification will be
shown, if the data is raster type, the interface for raster
classification will be shown.
Vectorial
The
available methods in Terralib
are:
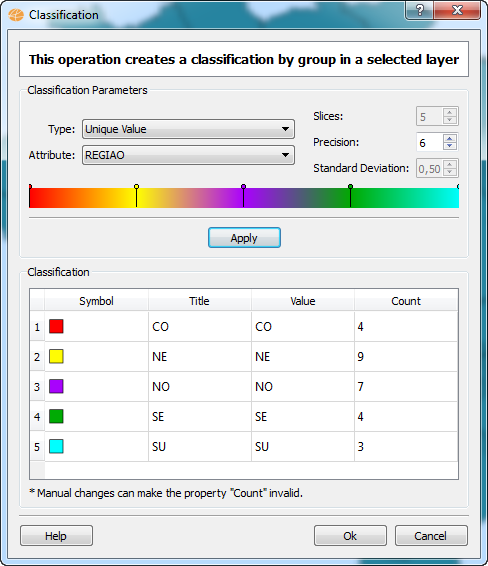
Unique Values: It groups the values using the unique value
algorithm.
Equal Steps: It groups the values defined by a range of
a attribute using the equal steps algorithm.
Quantil: It groups the values defined by a range of a attribute
using the quantil algorithm.
Standard Deviation: It groups the values defined by a range of a
attribute using the standard deviation algorithm.
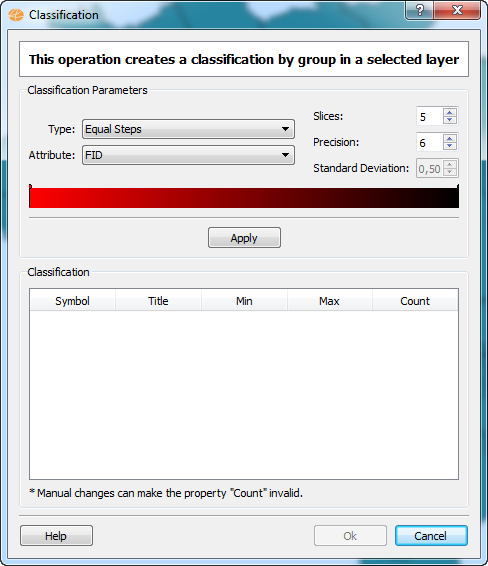
To execute this operation is
required the following steps:
Select the method for classification.
Select the attribute to be used for data classification. The
attributes listed may vary depending on selected method of
classification.
Set the number of slices to be created in the classification.
Sets the precision value.
Set the color ramp.
The "Apply" button will populate the table with slices generated.
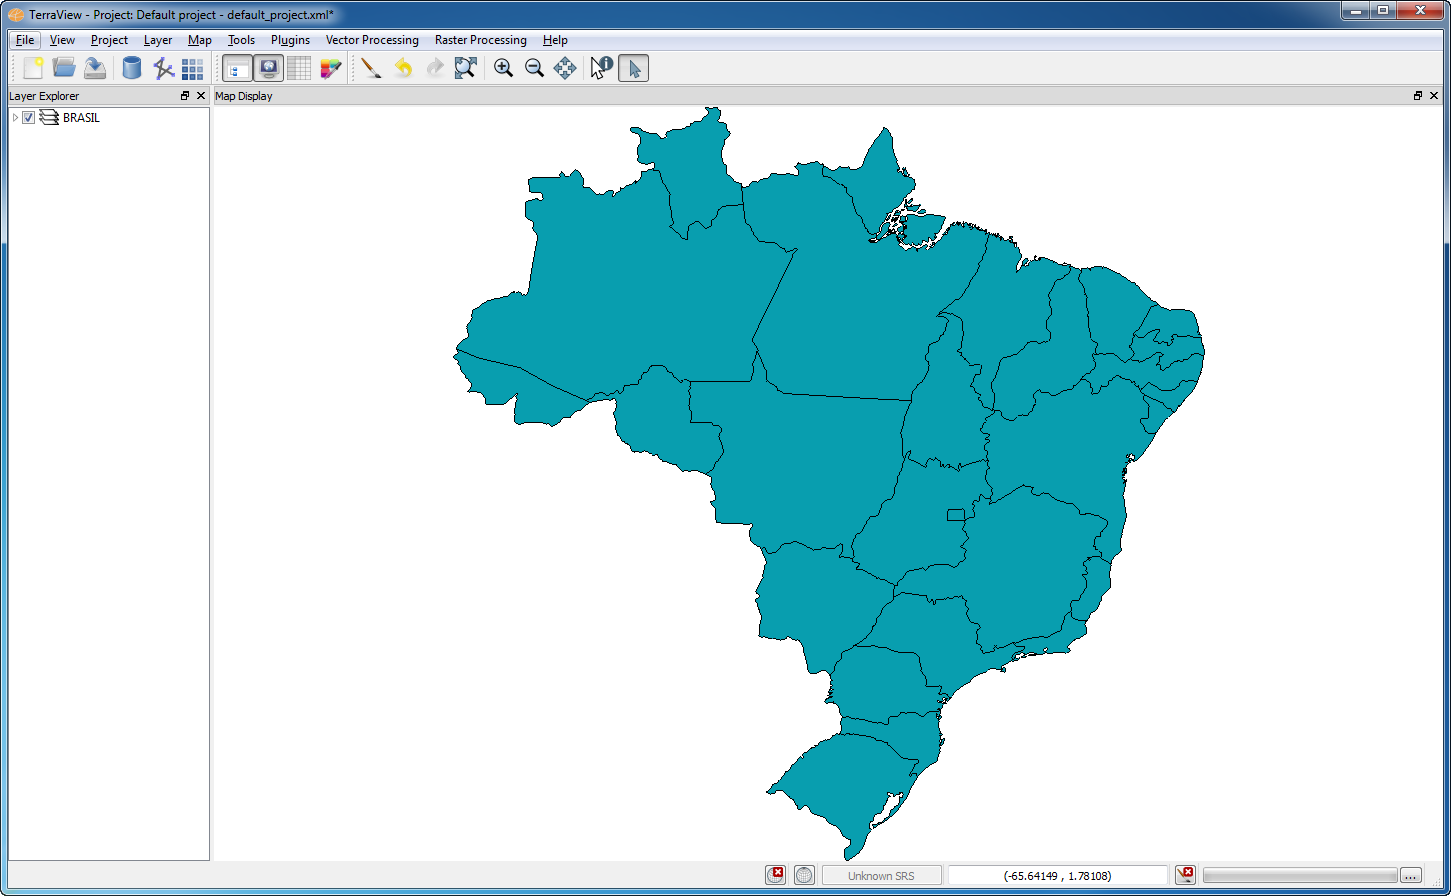
Example of vectorial classification:
Input Data:
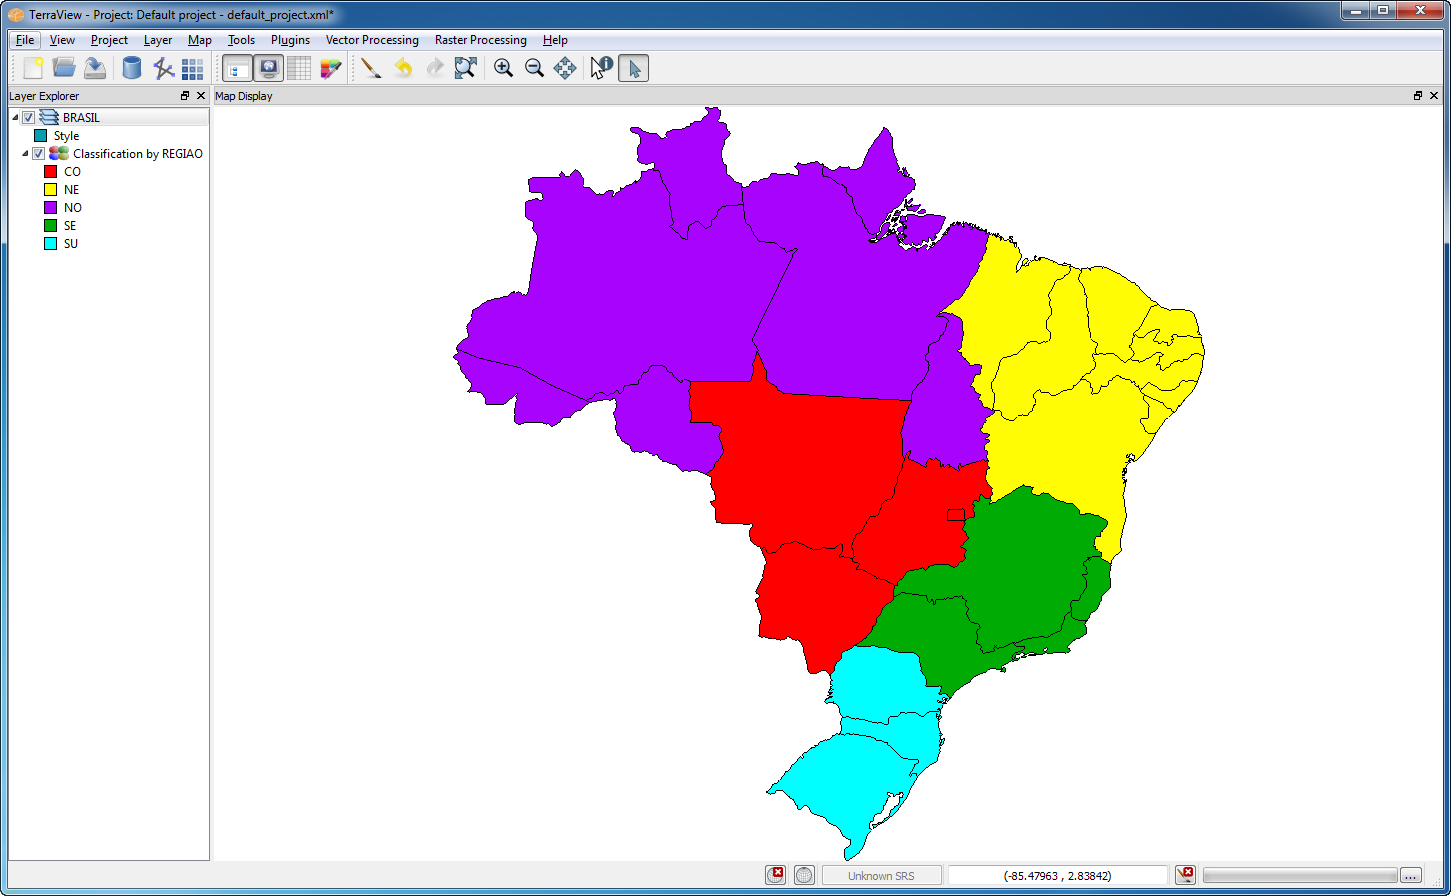
The result
of this operation is shown in the figure below.
Raster
The
available methods in Terralib
are:
Categorize: The transformation of continuous values to distinct
values.
Interpolation: The transformation of continuous values to a
number of values.
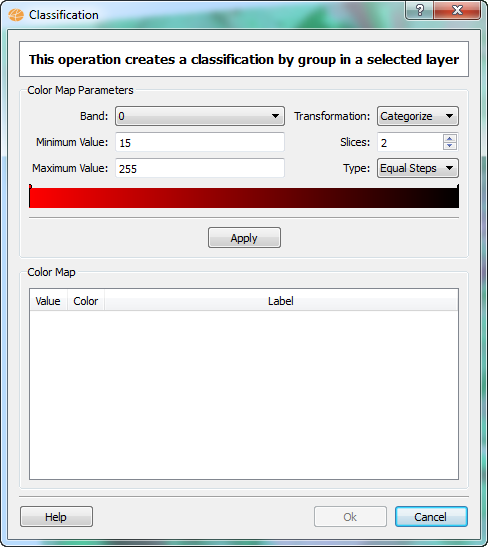
To execute this operation is
required the following steps:
Select the band to be applied the classification.
Set the minimum value. The suggested value is the minimum value
found in the selected band.
Set the maximum value. The suggested value is the maximum
value found in the selected band.
Select the method for classification.
Set the number of slices to be created in the classification.
Defines how data is classified.
Set the color ramp.
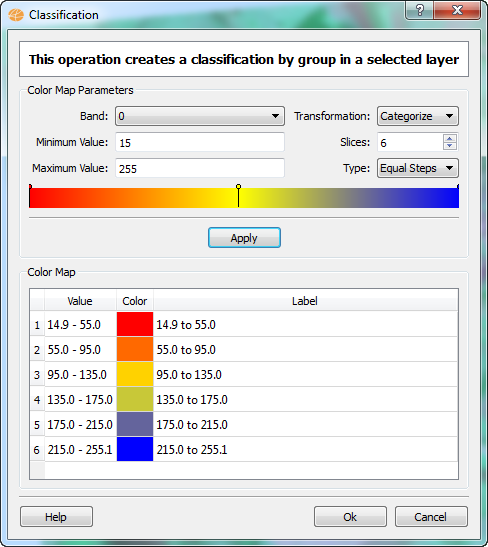
The "Apply" button will populate the table with slices generated.
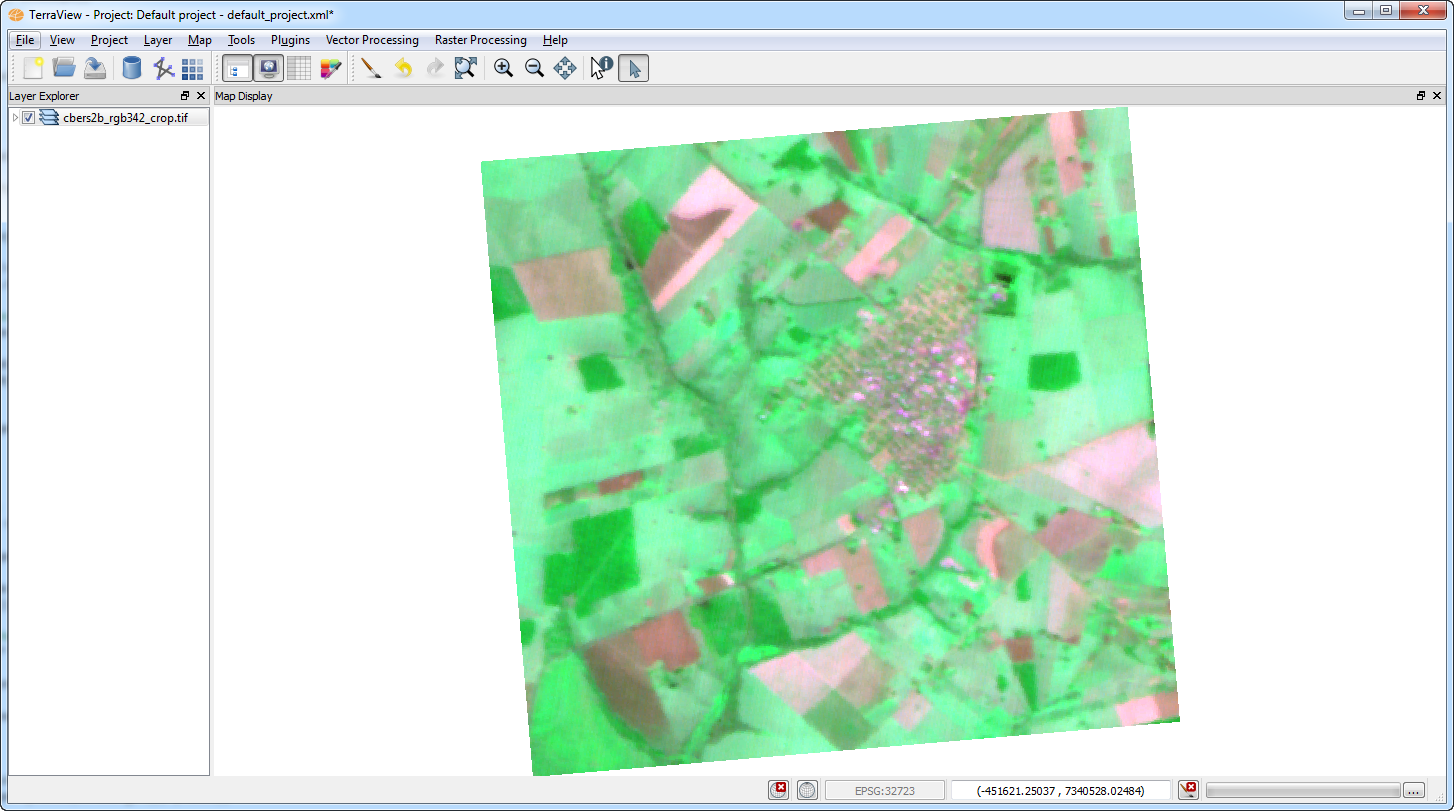
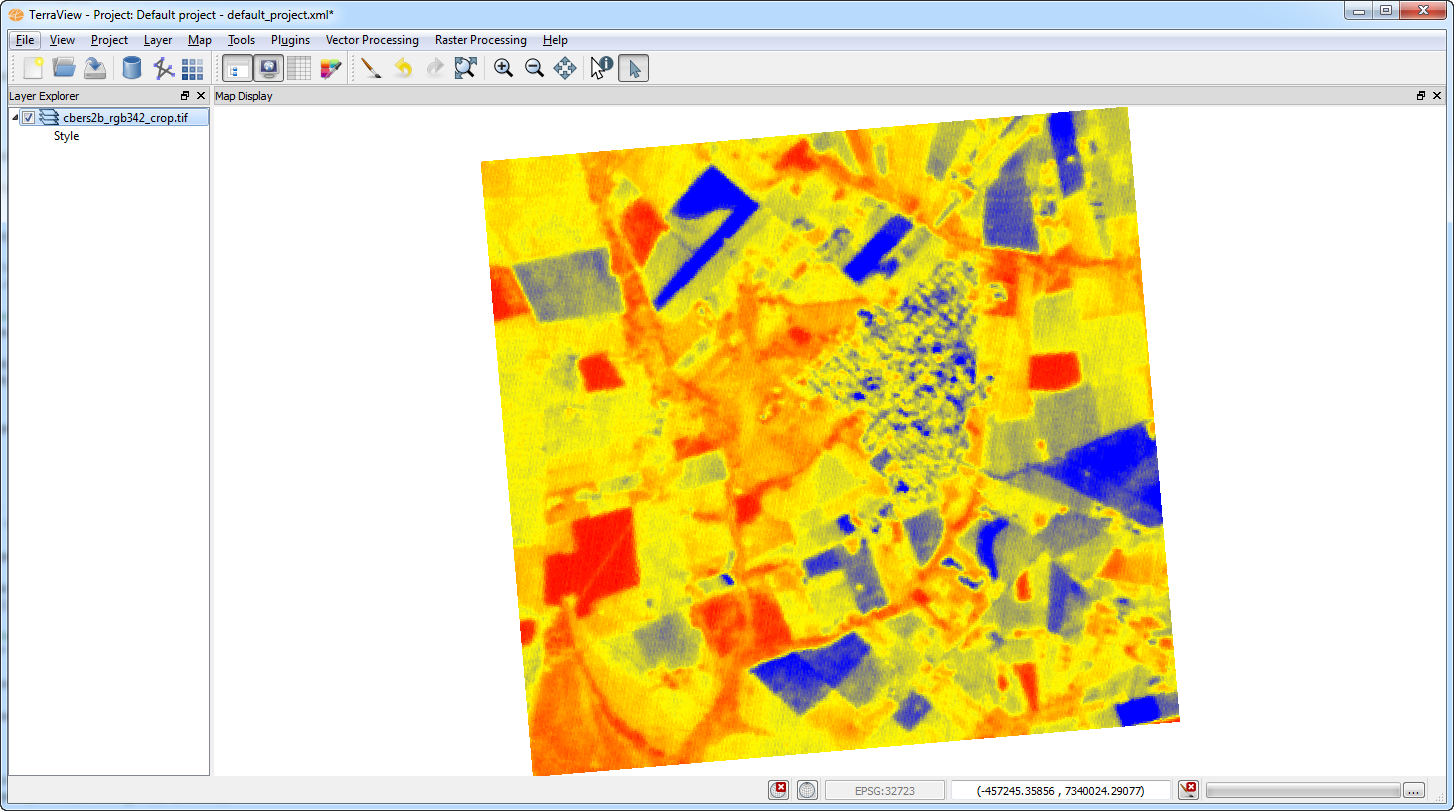
Example of raster classification:
Input Raster:
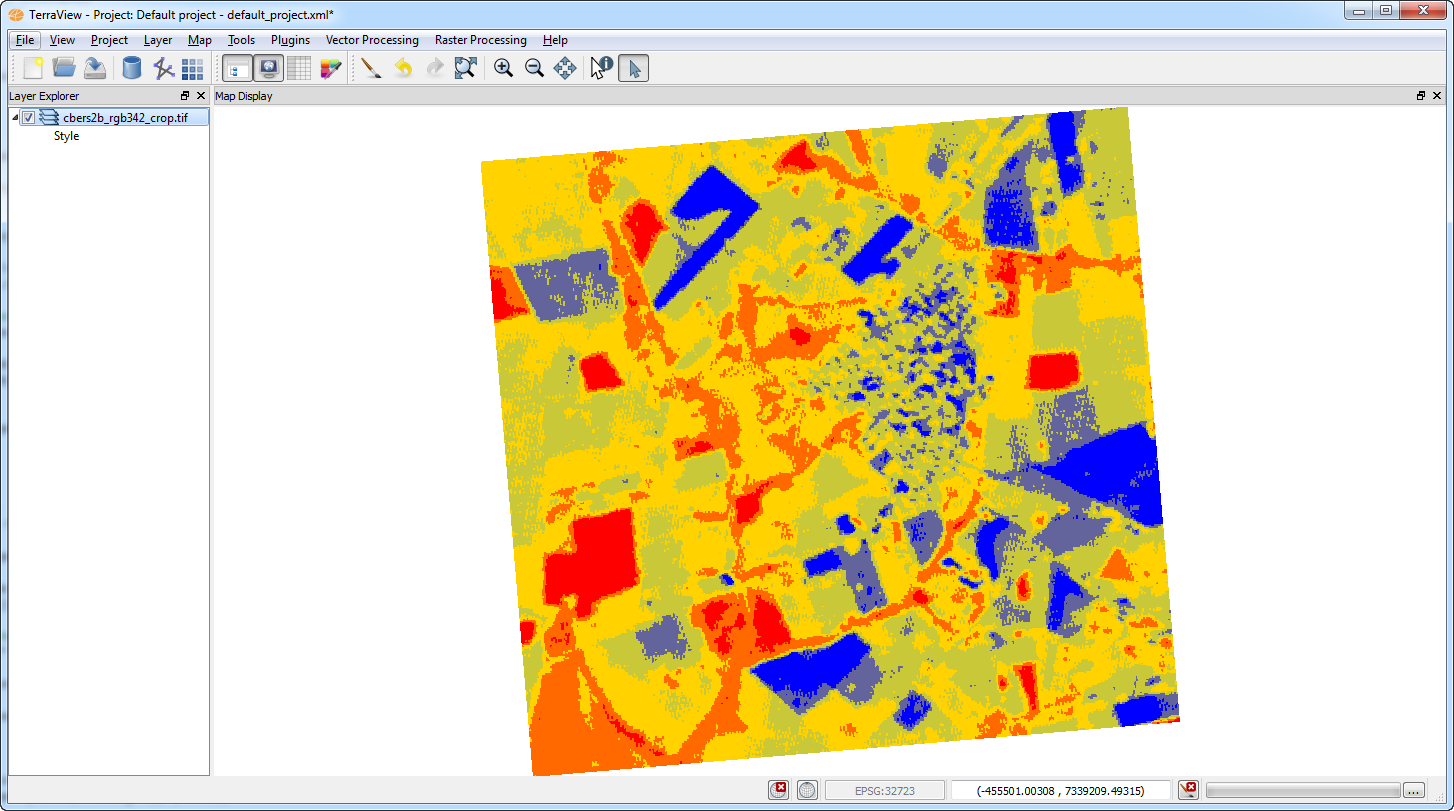
The result
of this operation using Categorize method is shown in the figure below.
The result
of this operation using Interpolation method is shown in the figure
below.