It is accessible through:
Layer Explorer > Right Click over a Layer-name > Style Explorer
View > Style Explorer
The
explorer style has three distinct components:
Properties:
Properties:
The only parameters for a Local Image is:
 and specify the attribute to be used. The basic parameters of a Text Symbology can be changed:
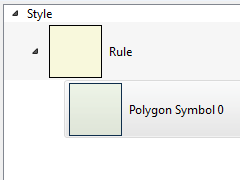
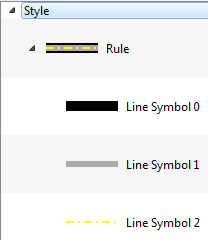
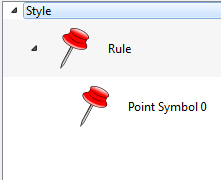
- Style Explorer: Uses a tree structure (style, rule and symbolizer) to represent the hierarchy of the style associated with the layer. The tree structure is shown bellow with examples of styles for polygon, line and point:
- Style: It is the top level and represents the layer style. A style can have more than one rule, each one can represent a restriction over the data. The default behavior is one rule per layer without restrictions.
- Rule: A rule is composed by a set of symbolizers defined in the next tree level. The default rule has no restriction and includes all data.
 It is only a shortcut to the Draw Tool
in the application and draw the layer using the defined style.
It is only a shortcut to the Draw Tool
in the application and draw the layer using the defined style.
- It adds an attribute as a text over the layer. To change
the text properties go to Symbology component.
 It adds a new symbol to the rule. Initially, the symbol
added is a clone of the selected symbol (default). To change
the properties that define its symbology go to Symbology component.
It adds a new symbol to the rule. Initially, the symbol
added is a clone of the selected symbol (default). To change
the properties that define its symbology go to Symbology component.
 It removes the selected symbol from the rule.
 and
and  changes the order of the symbol in the rule.
 It
is used to change the scale of the symbols used to compose the rule and
displays at preview. It will not take effect on the Map Display.
It
is used to change the scale of the symbols used to compose the rule and
displays at preview. It will not take effect on the Map Display.
 It is used to open a library manager from where is it possible to
search and pick up the symbol.
It is used to open a library manager from where is it possible to
search and pick up the symbol.
- Symbology: This component allows the user to modify the symbol, accessing all properties belonging to the selected symbols. The details may vary depending on the feature being represented. The feature types and their properties are listed bellow and the links leads to the Symbolizers session:
- Polygons:
- Lines:
- Basic Symbology (only stroke)
- Points:
- Raster:
- Text:
Symbolizers
A
Symbolizer is an abstract type for encoding the graphical properties
used to portray geographic information. A Symbolizer
describes how a feature will appear on the map. The Symbolizer describes
not just the shape that should appear but also such graphical
properties as color and opacity. A Symbolizer is obtained by specifying
one of a small number of different types of Symbolizers and then
supplying parameters to override its default behavior.
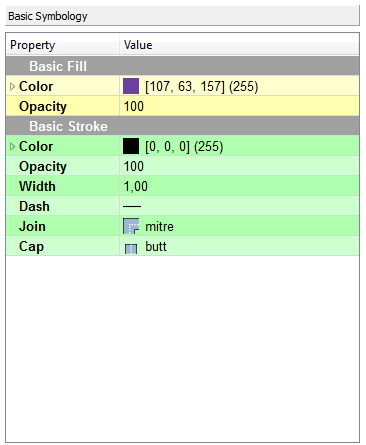
Basic Symbology
Basic Fill
A Fill specifies the pattern for filling an area geometry.Properties:
- Color: Sets the color used to draw the fill.
- Opacity: Sets the opacity to draw the fill.
Basic Stroke
A Stroke specifies the appearance of a linear geometry.Properties:
- Color: Sets the color for the contour drawing.
- Opacity: Sets the opacity for the contour drawing.
- Width: Sets the width for the contour drawing.
- Dash: Sets the dash for contour drawing.
- Join: This property defines how a line should be joined (between line segments).
- Cap: This property defines how a line should be capped (at the two ends of the line).
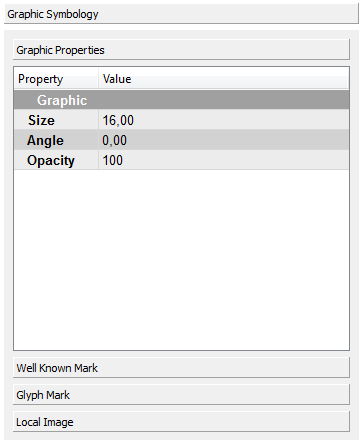
Graphic Symbology
A Graphic is a graphic symbol with an inherent shape, color(s), and possibly size. A graphic can be defined very informally as "a little picture" and can be either a raster or vector-graphic source type.Graphic Properties
The basic parameters of a graphic symbology are:- Size: Sets the size for the graphic drawing. If a size is specified, the height of the graphic will be scaled to that size and the corresponding aspect will be used for the width.
- Angle: Sets the angle for the graphic drawing. It gives the rotation of a graphic in the clockwise direction about its center point in decimal degrees, encoded as a floating-point number. Negative values mean counter-clockwise rotation.
- Opacity: Sets the opacity for the graphic drawing.
Well Known Mark
A WellKnown Mark are geometric shapes used to represent a feature in a map. Available shapes include at least circle,
square, cross, triangle, star and x, although map servers may
draw a different symbol instead if they don't have a shape for
all of these.
The basic parameters of a Well Known Mark are:
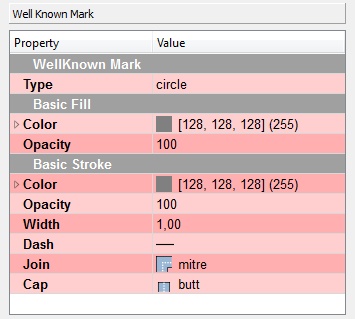
The basic parameters of a Well Known Mark are:
- Type: Defines the Well Known Mark type (circle, square, cross, triangle, star, x among others)
Glyph Mark
The
alternative to the Well Known Marks is an external mark format.
The Glyph Mark allows to use a TrueType font file and select
an individual glyph from that file.
The basic parameters of a Glyph Mark are:
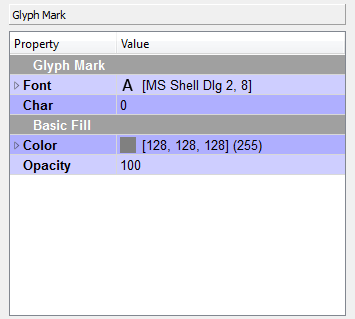
The basic parameters of a Glyph Mark are:
- Font: Defines the True Type font to be used.
- Char: Defines a specific character in the font selected.
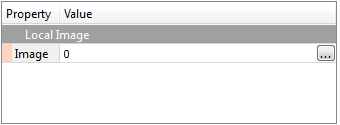
Local Image
Another type of mark that can be defined is the image files (png files). To define it click on the valueThe only parameters for a Local Image is:
- Image:
Displays a dialog box that allows you to choose a local file containing
an image. Click on the value and then on the
 .
.
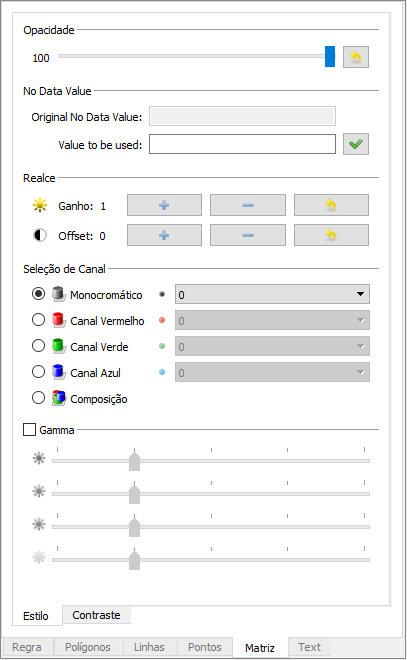
Raster Symbology (Style/Contrast)
A
Raster Symbology is used to specify the rendering of
raster/matrix-coverage data (e.g., satellite images, DEMs). It is
also possible to define a Contrast. Everything is saved into the
current TerraView Project, however it does not change the original
raster.
The basic parameters of the Style in a Raster Symbology are:
The basic parameters of the Style in a Raster Symbology are:
- Opacity: Sets the opacity to draw the raster.
- No Data Value: it shows
the Original 'No Data Value' and allows you to change it. If it
is empty you can inform the appropriated Value to be used (use the
 over the map display to guess the value). Click on the
  after changing the 'Value to be used'.
- Enhancement: Allows to apply enhancements over the image so that the changes are applied equally on all bands.
- Brightness: Lets you adjust the brightness of the image.
- Sharpness: Lets you adjust the sharpness of the image.
- Channel Selection: The Channel Selection property specifies the false-color channel selection for a multispectral raster source (such as a multi-band satellite-imagery source).
- Mono: Defines a band to be displayed on the gray channel.
- Red: Defines a band to be displayed on the red channel.
- Green: Defines a band to be displayed on the green channel.
- Blue: Defines a band to be displayed on the blue channel.
- Composition: Allows selection of three bands to do the color composition on red, green and blue channels.
- Gamma: click it to enable the contrast manipulation of the selected channel.
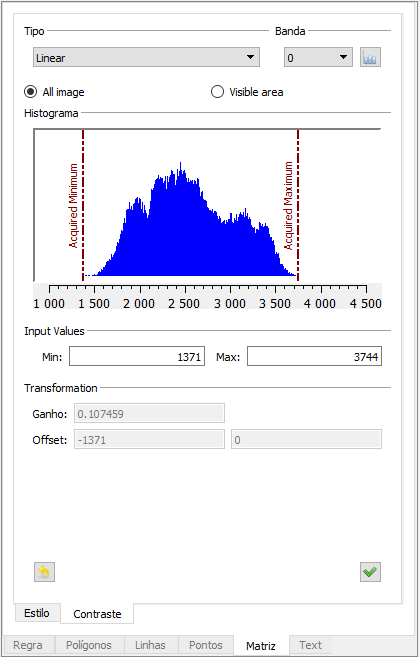
- Contrast: use this tab to change the contrast and use
 to show the graphic, to apply the contrast, and
  recompose the contrast. Also change the min and max by clicking over the graphic.
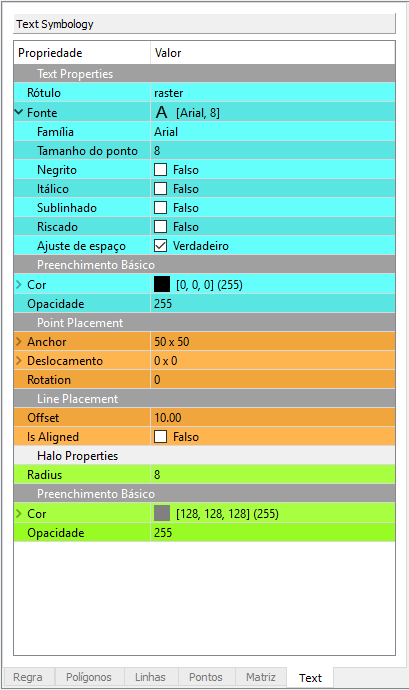
Text Symbology
To add a Text Symbology as part of the style, click on and specify the attribute to be used. The basic parameters of a Text Symbology can be changed:- Text Properties
- Label: Select one of the attribute to be used as a label (name, id).
- Font: Select the font to be used (ex Arial).
- Basic Fill: Select text color and optionally opacity
- Point Placement: it changes the position where to place the text.
- Anchor
- Displacement
- Rotation
- Line Placement
- Offset
- Is Aligned
- Halo Properties
- Radius
- Basic Fill
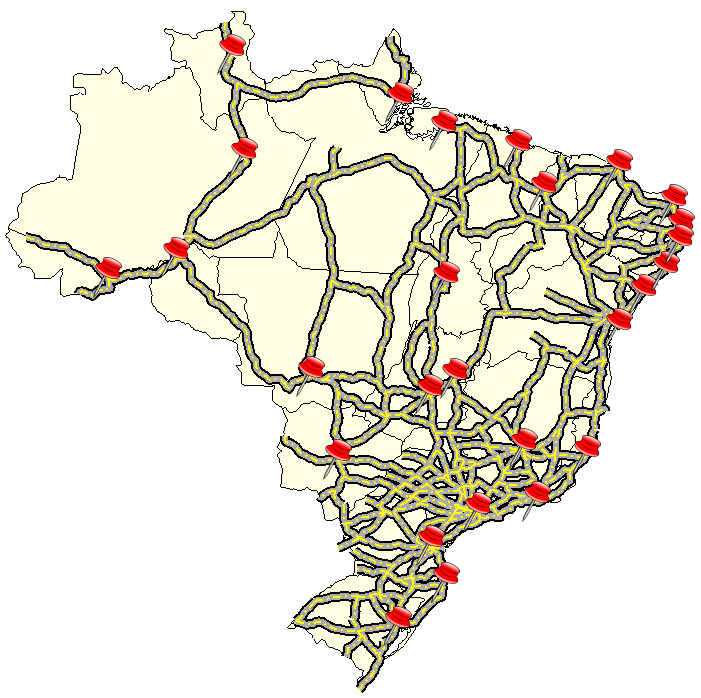
Example
In this example three vector data were used and its three respective styles(rules) where defined by the Style Explorer:- Polygons: Brazil.
- Lines: Highway of Brazil.
- Points: Capitals of Brazil.