The Edit Legend toolcan be used in both vector and raster data. The basic principle of
this type of classification is grouping
the data following the logic of some selected method.
It is
accessible through:
Layer
Explorer > Right Click over a
Layer-name > Edit Legend...
Layer > Edit Legend...
The interface shows specific parameters depending on the data type
chosen, Vector or Raster.
Vector
The
available methods in TerraLib
are:
Unique Values: It groups the values using the unique value
algorithm.
Equal Steps: The entire range of values (max - min) is
divided equally into however many categories have been defined. It
groups the values defined by a range of an attribute using the equal
steps algorithm.
Quantil: This method classifies data into a certain number of
categories with an equal number of units in each category. It
groups the values defined by a range of a attribute
using the quantil algorithm.)
Standard Deviation: It groups the values defined by a range of a
attribute using the standard deviation algorithm.
The parameters necessary to create a Legend are grouped in frames at the interface.
See the details bellow.
Frame 1 - Import Layer Grouping
- Check this box to import the parameters used to generate a legend in other layer.
Layer - select the layer
from where to import the parameters used to generate the Legend. It might
not be possible to import any of them.
Press Import
Frame 2 -
Parameters
Type - Select the method
of classification (unique value, equal steps, quantil) to be used to generate the legend.
Attribute - Select the
attribute to be used in the classification. The
attributes listed may vary depending on selected method of
classification.
A summary function may be chosen if the classification is being
generated based on a linked dataset, otherwise this function is not
visible.
Slices - Set the number
of slices to be created by this classification.
Precision - Sets the
precision value.
Standard Deviation
-
Color Bar - Set
the color ramp as explained here.
Use Schema - heck this box and choose one of the predefined Group and Schema to set the color bar:
Catalog -
Group -
Schema -
Press Apply to show the Legend Frame with the
slices identified by Symbol, Title, Mim, Max, Count.
Press OK to generate the Legend with these parameters or change the parameters and apply again.
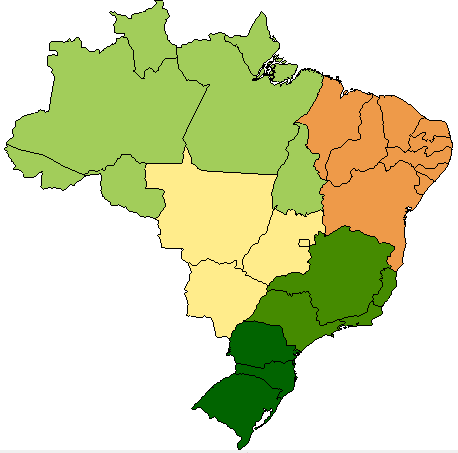
The result
of classification by region over Brazil states, using Unique Value type, is showed bellow.
Raster
The
available methods in TerraLib
are:
Categorize: The transformation of continuous values to distinct
values.
Interpolation: The transformation of continuous values to a
number of values.
The parameters necessary to
execute the Classification are grouped in frames at the interface.
See the details bellow.
Frame 1 - Import Layer Grouping
- Check this box to eventually use the same parameters used to generate a legend in other
layer
Layer - select the layer
from where to import the parameters of classification. It might
not be possible to import any of them.
Press Import.
Frame 2 - Parameters
Band - Select which band
will be classified.
Minimum Value - Set the
minimum value (the suggested value
is get from the selected band).
Maximum Value -
Set the maximum value (the suggested value is get from the
selected band).
Transformation - Select
the method for classification (categorize or interpolation).
Slices - Set the number
of slices to be created in the classification.
Type - Defines how data
is classified.
Color Bar - Set
the color ramp as explained here.
Use Schema -
Catalog -
Group -
Schema -
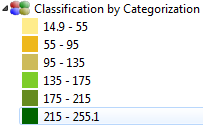
Press Apply to show the Color Map with the slices
identified by Color, From and To.
Press OK to generate the
Legend with these
parameters or change the parameters and apply again.
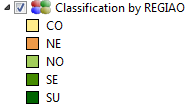
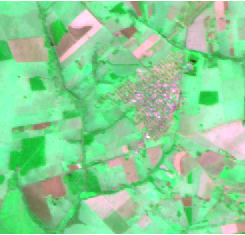
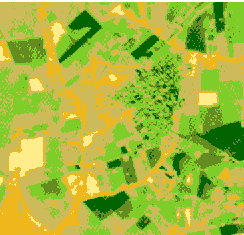
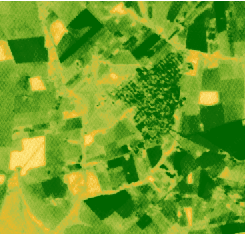
The figures bellow show a original
image in color composition, band-0 and the results of classification.
RGB-012
BAND-0
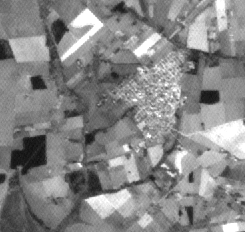
The Legend created when using Categorize
method with default parameters and 6 slices.
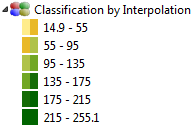
The Legend created when using Interpolation
method with default parameters and 6 slices.