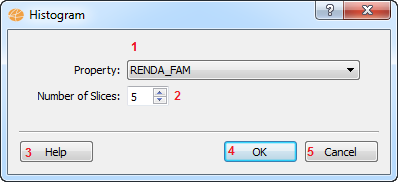
Interface description:
1 - Property selection -
This component lists all available properties that may be used to
generate a histogram.
2 - Number of slices - Used
to define the number of intervals of
the histogram that will be generated.
3 - Help button - Opens the
help window.
4 - Ok button - Creates the
histogram based on the information
provided.
5 - Cancel button - Closes
the dialog without generating a new
histogram.
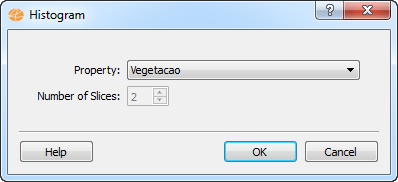
Note: In some cases, the user is not allowed to select a number of
slices. This happens when the type of the chosen property does not
support the calculation required to split the data among the intervals,
for example when the data is a text. If this happens, all unique values
are treated as intervals. In this case, the dialog will be as follows:
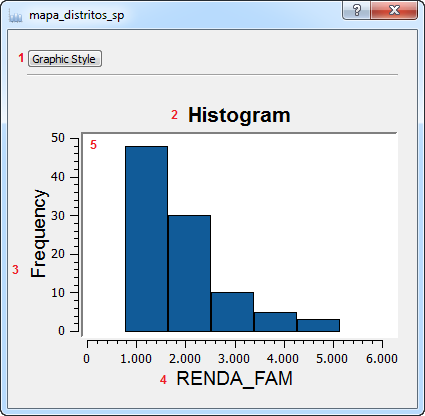
Once the histogram chart is
generated
it will show up on TerraView as the following screen:
Interface description:
1 - Graphic style button - Opens up the chart style
dialog.
2 -Title - Displays the title of the histogram chart.
3 - Y Axis label - Displays the Y axis' title.
4 - X Axis label - Displays
the X axis' title.
5 - Plot area - The are where the chart will be drawn.
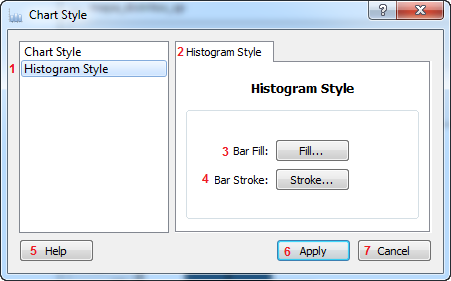
By clicking on the Graphic Style button it is possible to
configure some of the charts elements. Once clicked, the
following screen will be shown:
Interface Description:
1 - Histogram style item - When selected, displays the window
used to configure a histogram's style.
2 - Histogram Style tab - Displays the window used to
configure a histogram's style.
3 - Fill button - Displays the window used to configure the
histogram's bar fill.
4 - Stroke button - Displays the window used to
configure the histogram's bar stroke.
5 - Help button - Opens the help window.
6 - Apply button - Closes the
window applying the changes that were made.
7 - Cancel button - Closes the window without applying
any changes.
For a detailed description of the general style options, check the
chart style documentation.