Scatter
A
scatter plot is a type of mathematical diagram using Cartesian
coordinate to display values for two variables for a set of
data. The
data is displayed as a collection of points, each having the value of
one variable determining the position on the horizontal axis and the
value of the other variable determining the position on the vertical
axis.
In TerraView, a scatter is created based on a layer's data, therefore, it is accessible through:
Layer > Scatter...
Once a layer has been selected and the menu item has been clicked the following screen will be opened:

In TerraView, a scatter is created based on a layer's data, therefore, it is accessible through:
Layer > Scatter...
Once a layer has been selected and the menu item has been clicked the following screen will be opened:
Interface
description:
1 - Property X selection - This component lists all available properties that may be used to generate the X axis of the scatter's point.
2 - Property Y selection - This component lists all available properties that may be used to generate Y axis of the scatter's point.
3 - Help button - Opens the help window.
4 - Ok button - Creates the scatter based on the information provided.
5 - Cancel button - Closes the dialog without generating a new scatter.
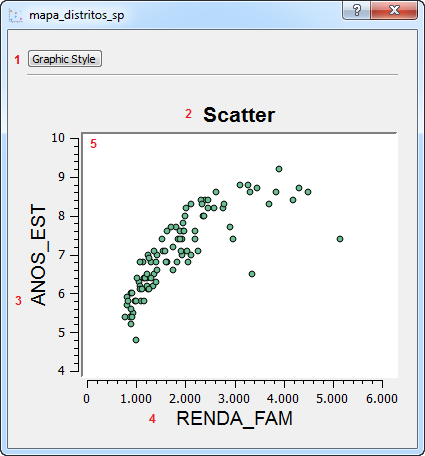
Once the scatter chart is generated it will show up on TerraView as the following screen:
1 - Property X selection - This component lists all available properties that may be used to generate the X axis of the scatter's point.
2 - Property Y selection - This component lists all available properties that may be used to generate Y axis of the scatter's point.
3 - Help button - Opens the help window.
4 - Ok button - Creates the scatter based on the information provided.
5 - Cancel button - Closes the dialog without generating a new scatter.
Once the scatter chart is generated it will show up on TerraView as the following screen:
Interface description:
1 - Graphic style button - Opens up the chart style dialog.
2 -Title - Displays the title of the scatter chart.
3 - Y Axis label - Displays the Y axis' title.
4 - X Axis label - Displays the X axis' title.
5 - Plot area - The are where the chart will be drawn.
By clicking on the Graphic Style button it is possible to
configure some of the charts elements. Once clicked, the
following
screen will be shown:1 - Graphic style button - Opens up the chart style dialog.
2 -Title - Displays the title of the scatter chart.
3 - Y Axis label - Displays the Y axis' title.
4 - X Axis label - Displays the X axis' title.
5 - Plot area - The are where the chart will be drawn.
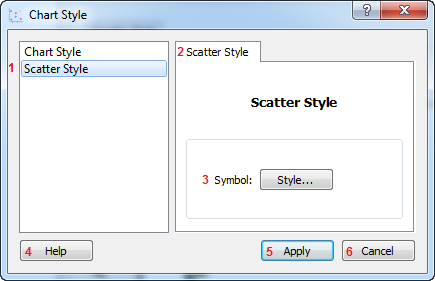
Interface Description:
1 - Scatter style item - When selected, displays the window used to configure a scatter's style.
2 - Scatter Style tab - Displays the window used to configure a scatter's style.
3 - Symbol button - Displays the window used to configure the scatter's symbol.
4 - Help button - Opens the help window.
5 - Apply button - Closes the window applying the changes that were made.
6 - Cancel button - Closes the window without applying any changes.
For a detailed description of the general style options, check the chart style documentation.